Arduino serial plotter usage
The Arduino IDE offers a useful tool that allows you to plot numbers generated by your code directly within the interface.
In principle, this feature is valuable. However, its practical application might pose some challenges due to the sparse documentation provided. In this guide, we'll delve into its usage and walk you through a brief demonstration.
TL;DR: Use this hidden documentation
Documentation
If you are reading this post, it is likely because there doesn't seem to be any good documentation to start with. I'm not alone in this feeling, someone reported this issue on Github. If you share this feeling I suggest you vote on that issue and/or actually help them out.
The Github issue also point to some actual documentation on this feature from the Arduino team.
Takeaway
Some things I took away from this hidden documentation:
First of, a message is a single line delimited by a newline.
A message corresponds to a vertical slice in the plotter.
So each vertical slice is done by writing <message>\n.
Secondly, you can plot basic numbers, or they can be labelled.
Labels can either be set once in the setup, OR you can pass them along each line.
I found the label variant to work best, so temp:30\n.
Now, if you use labels, don't add a space after the ":"!
So write:
temp:20
Do NOT write:
temp: 20
The latter does not work as expected and is hard to find if you don't recognize it!
If you want to plot multiple values, use a space, tab or comma delimiter. e.g.:
temp:30 humid:20\n
Finally, there does not seem to be a way to clear the plotter or only capture part of the serial output. So if you want to plot data and use log some other data, you are out of luck.
Plot something
A convenient way to plot a value with label is by writing this "one liner"
Serial.print("{{label}}:"); Serial.print(variable); Serial.print(", ");
Track as many variables as you want and finish with a newline:
Serial.println();
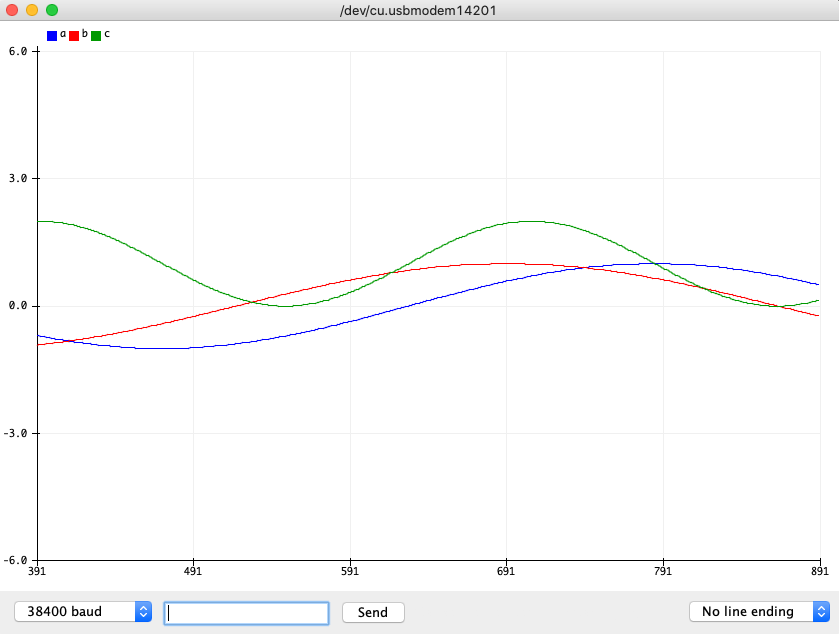
The following code shows how we can use this to display three labelled graphs:
int t = 0;

void setup() {
    Serial.begin(38400);
}

void loop() {
    double a = sin(t / 100.0);
    double b = cos(t / 110.0);
    double c = sin(t / 50.0) + 1.0;
    Serial.print("a:"); Serial.print(a); Serial.print(", ");
    Serial.print("b:"); Serial.print(b); Serial.print(", ");
    Serial.print("c:"); Serial.print(c); Serial.print(", ");
    Serial.println();
    t++;
    delay(40);
}
Upload the code and open the serial plotter (Tools > Serial Plotter). Your result should resemble the following gif:
Final words
Hopefully, this will assist you in your programming journey. Here are some closing tips:
- If you encounter too many or garbled labels, consider closing the serial plotter and reopening it. It's possible that the plotter captured some erroneous serial data.
- As always, if the upload fails, reset the Arduino using the small reset button (if available).
Close the serial plotter and consider reducing the load on the serial line.
For instance, you can increase the delay between
loopiterations.
