Coronavirus spread animation
A lot of headlines show new Coronavirus infections popping up here and there. However it is difficult to get a sense of the scope and the rate of infections. To get a feeling of how things are developing nothing beats a good graphic. Dissatisfied with existing maps I ended up creating my own map.
Reinventing the wheel
So why create a new interactive map when there are already so many out there? Well, first, I could not find any map to communicates the spread over time.
Secondly, most other maps seem to misrepresent the underlying data. Either exacerbating it or not providing enough context to make sense of it. I'll try to do better (though there are of course still shortcomings noted later). Most of my gripes with other maps are explained in this post (excellent read).
Mapping the coronavirus mapping landscape
Although it seems obvious to me that visualizing the spread of a virus over time very useful, I haven't found a map showing this. There are graphs showing cases over time and all. But they don't convey locality and time of the outbreak as well as a map.
Many other maps simply focus on a single area.
But to communicate the spread and infection rate of this virus, and we need a larger scope than just China or
Yet my biggest concern with most maps is that the affected area is totally off. This is generally because an entire country is highlighted for a handful of cases. It's misleading to color the whole of Russia for only two cases. It gives the impression the infection is way larger than it actually is.
See this map below how to give the impression that almost half of the world is "infected". And yes, the legend tells us how many cases there are. But, for me at least, my brain does not register some number as well as half the world being colored a shade of red.
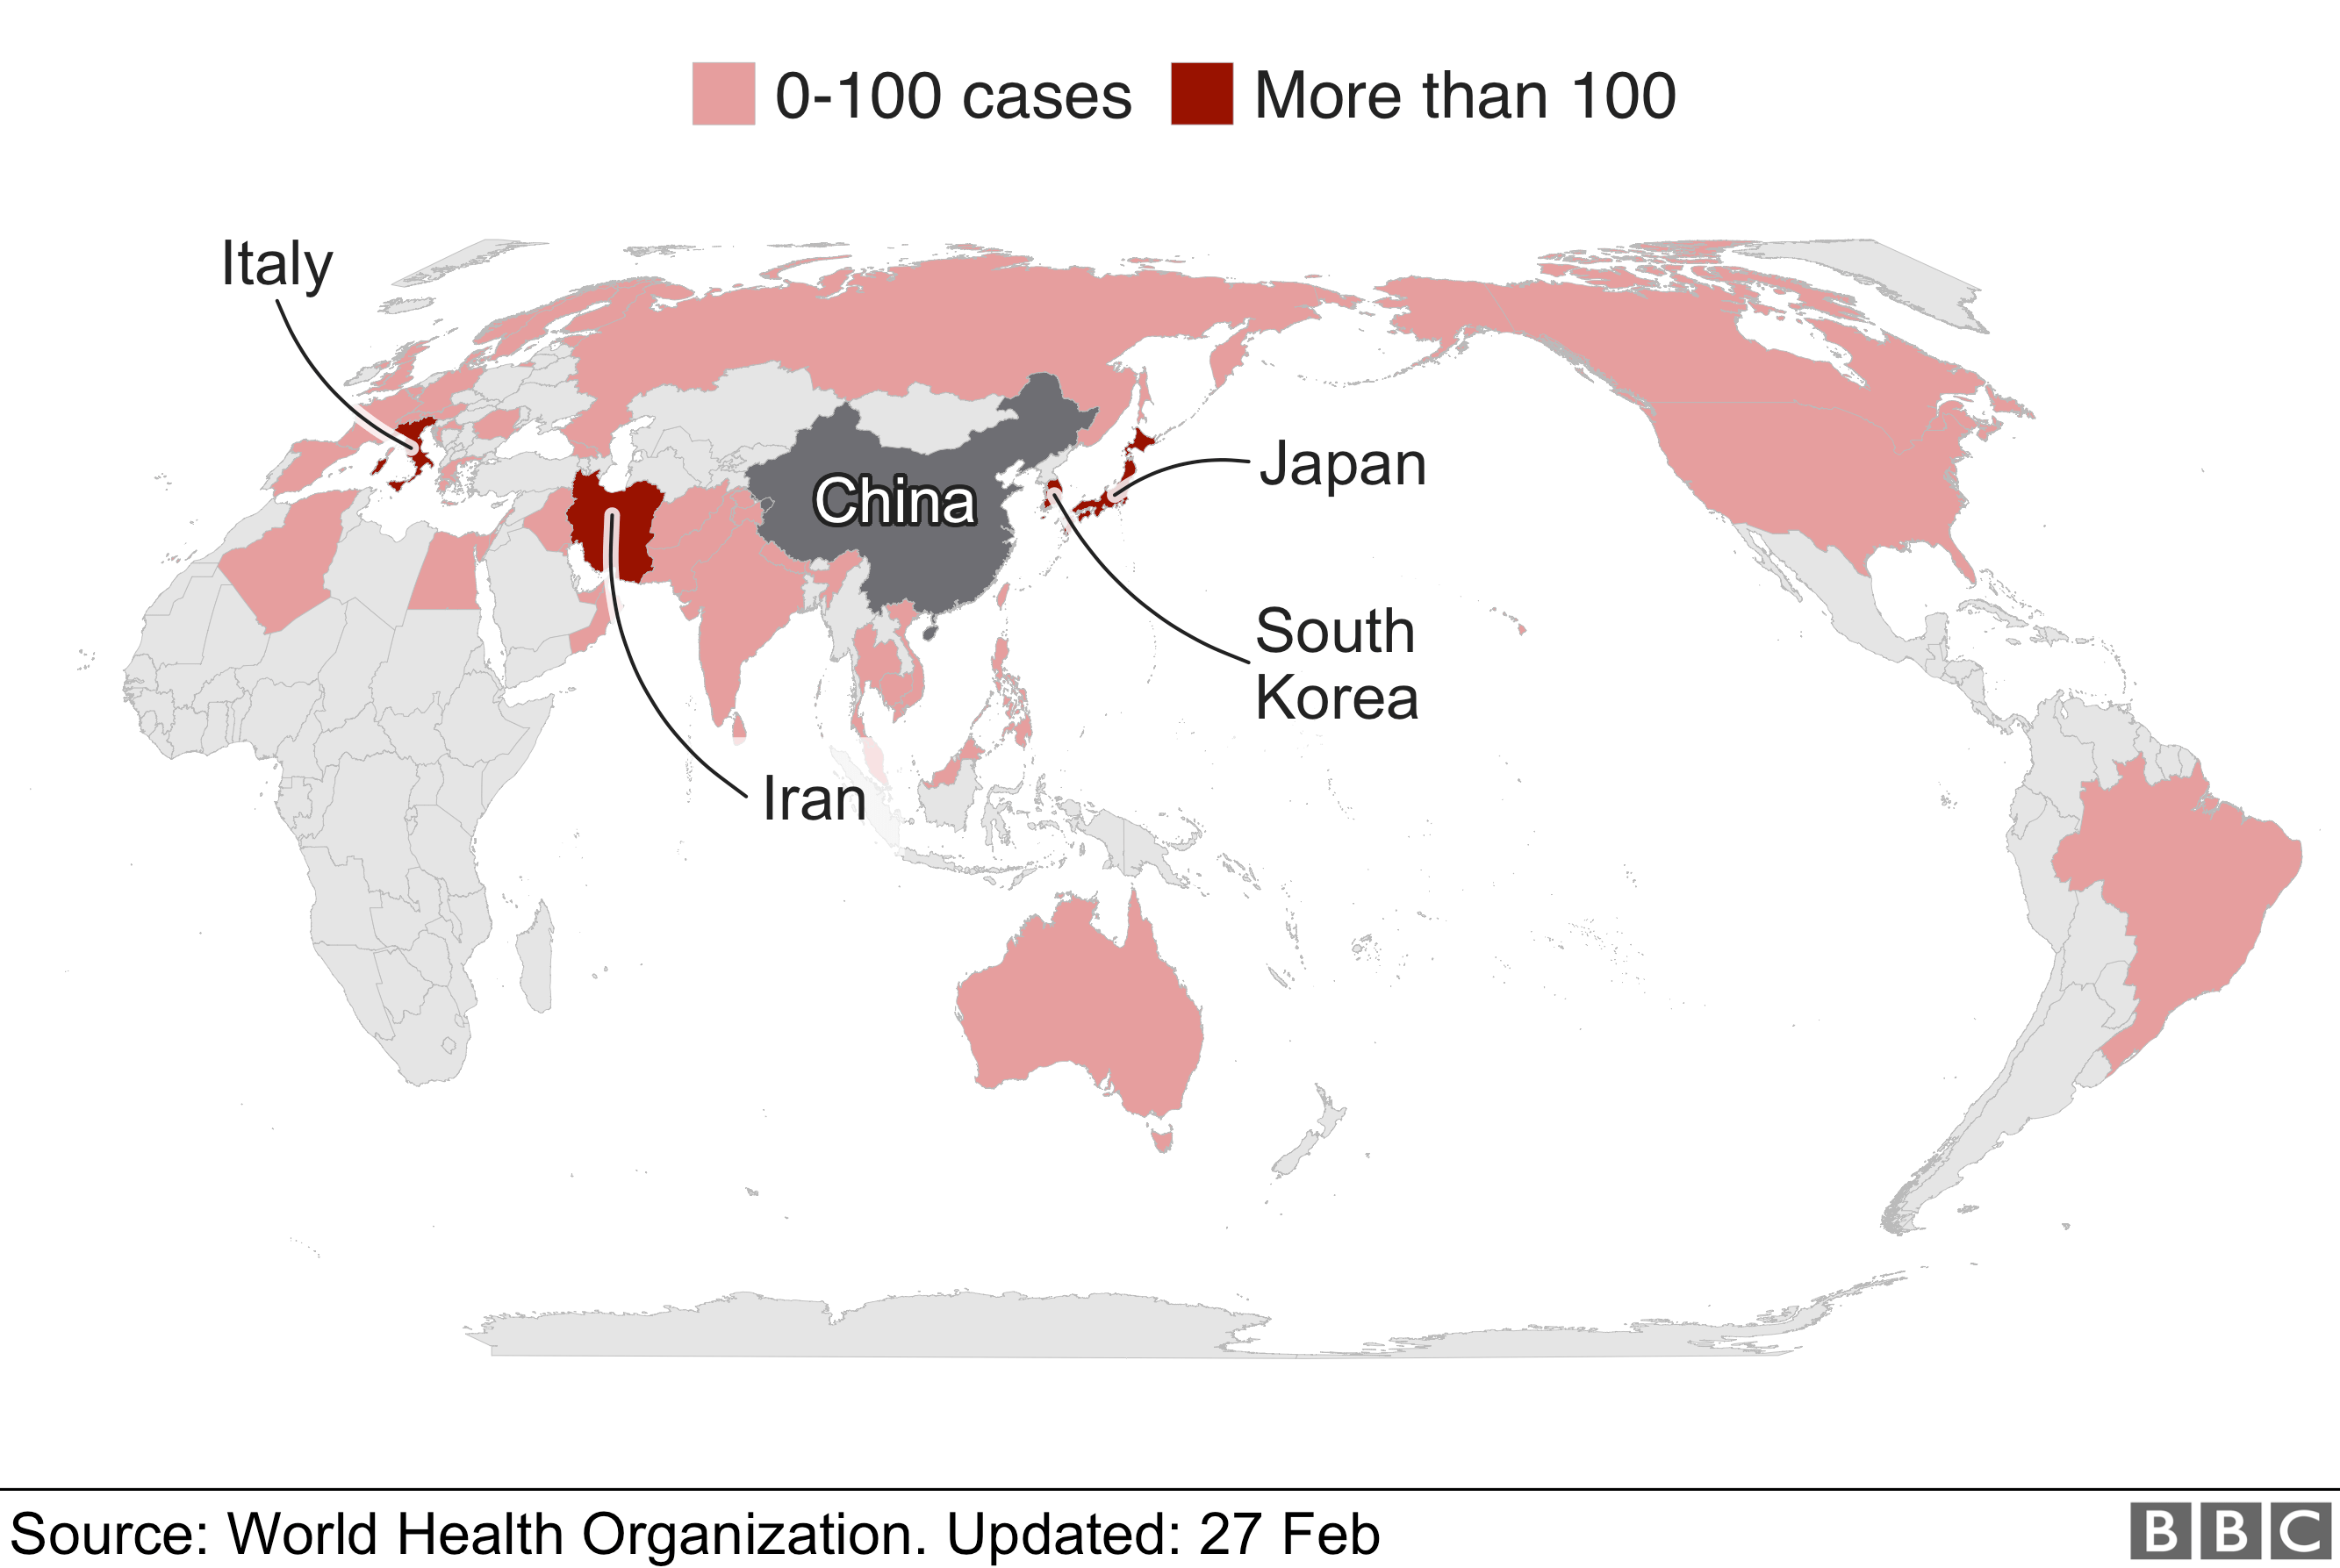
And the numbers are still unclear at this point on the mortality. But I would say the biggest concern for this virus is actually people over reacting to it. Having the BBC and the World Health Organization use such a graphic seems irresponsible.
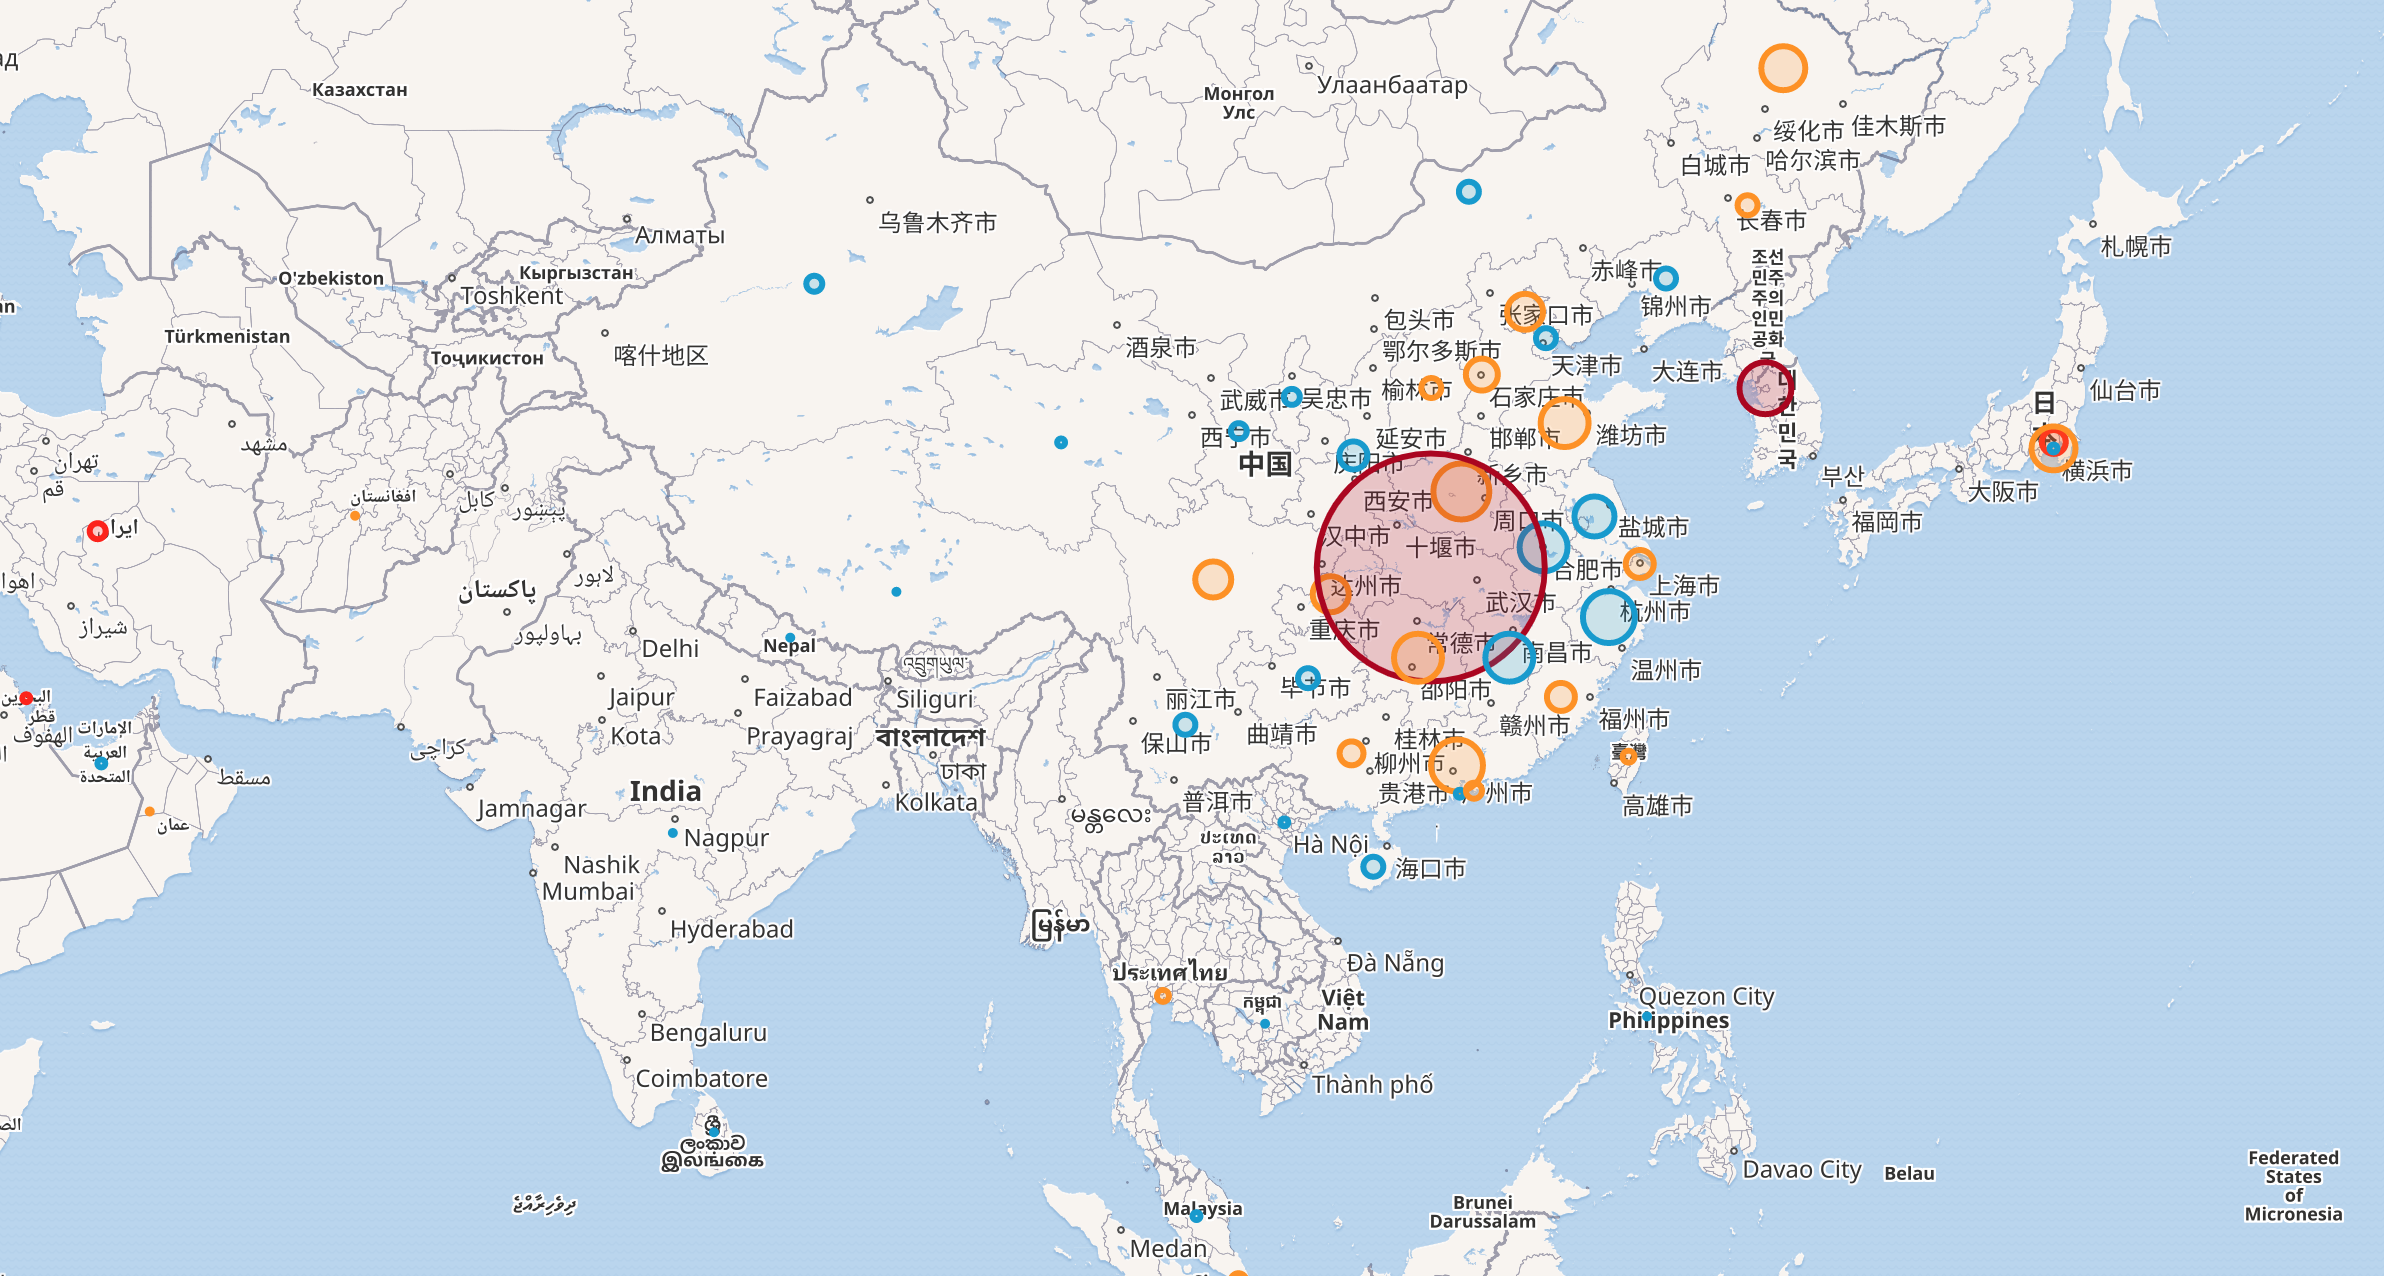
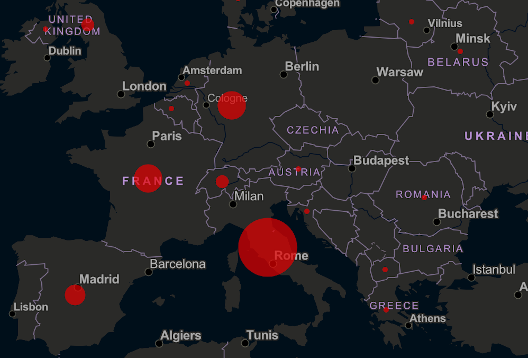
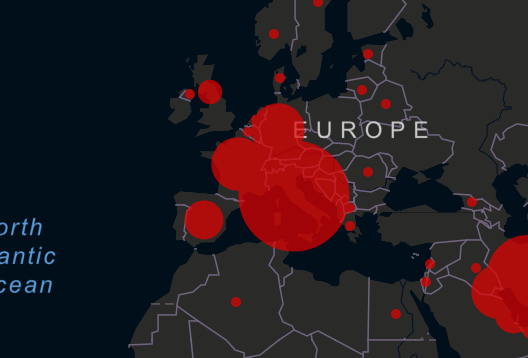
Finally this map is a great step in the right direction. Yet like many others the markers don't scale well. If you zoom out enough, the affected area is exaggerate to much. And although this is far from the worst example, it can already give the impression that nearly the whole of Europe is infected:
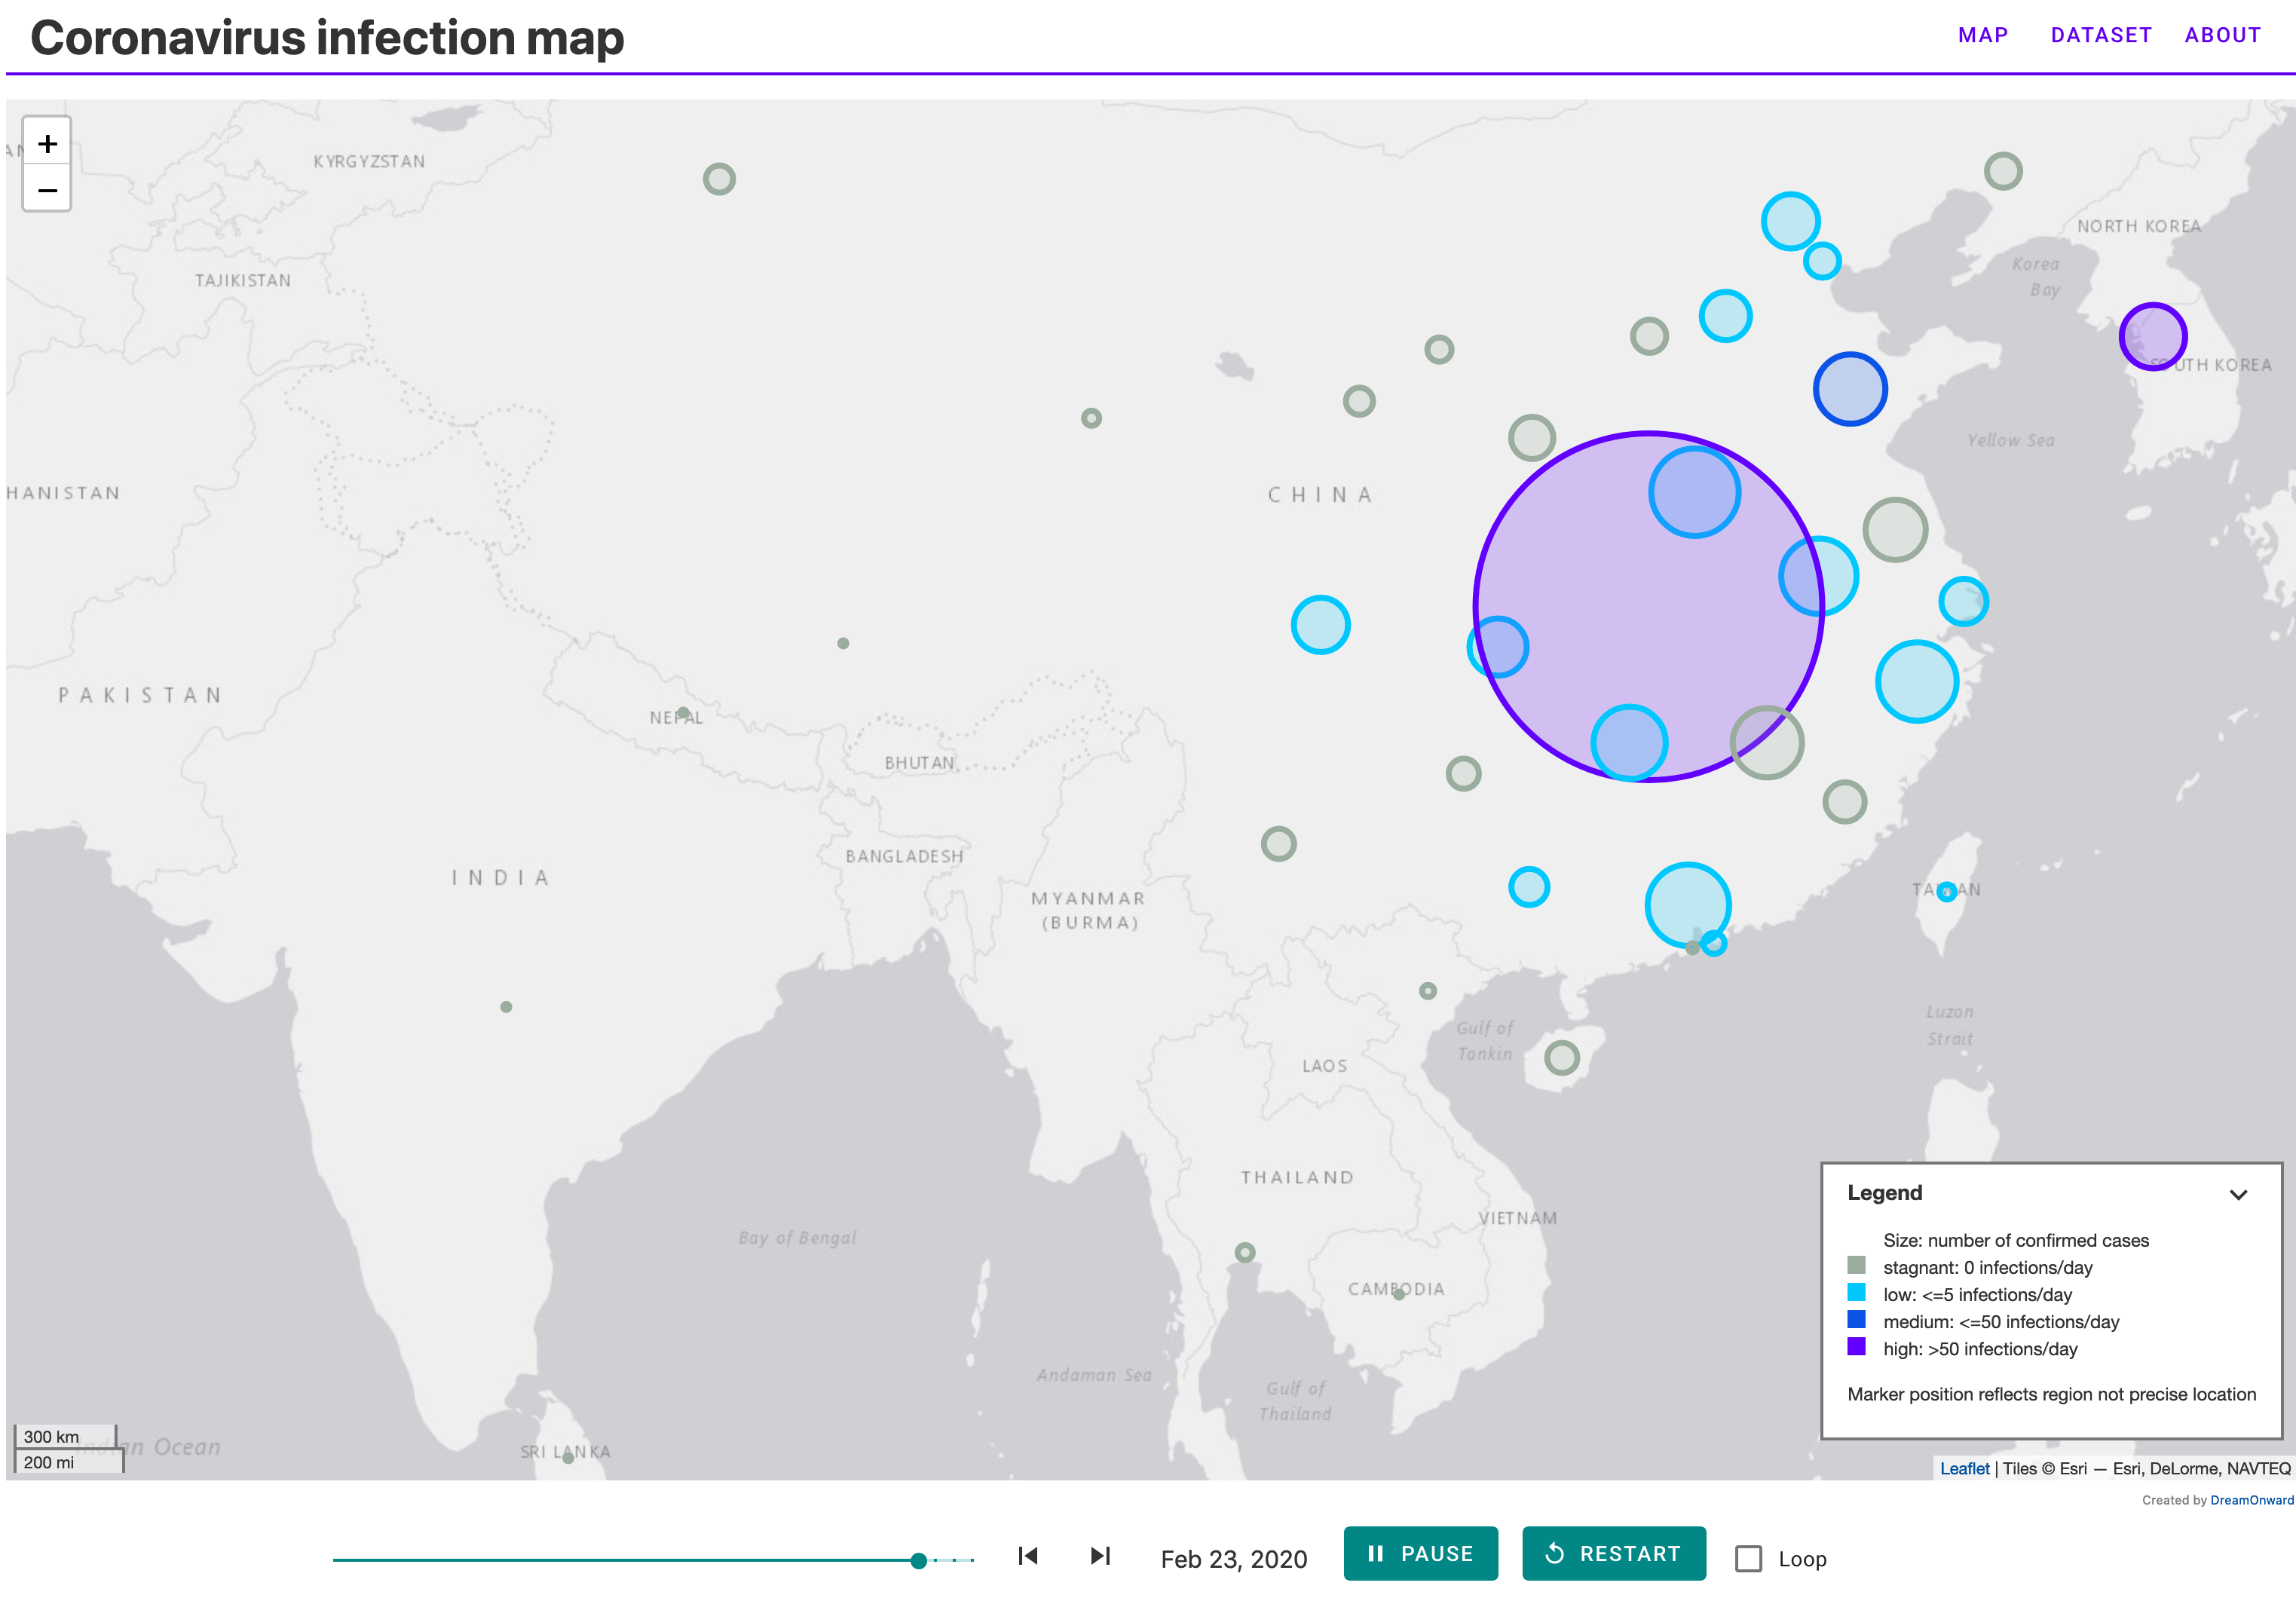
New design
So that brings us to the design of the new app. The main focus of this map is to big picture view of the virus spread over time.
Here are some of the design considerations:
- Size is used to show number of confirmed. Radius starts out relatively large because it is required to see at a distance.
- Color is used to indicate infection rate. To not only indicate where the virus has been, but rather, where it is active.
- Markers are scaled with the map. So while they may not fully reflect the affected area, they also don't increase to the size of continents when zooming out.
- Color coding is done using "bluey-green"-ish color scheme. This is more fitting for this case (excellent point @esri). Though colors are a lot more saturated to make them visible from a distance (the red was great for contrast).
Of course some limitations still apply:
- Size is not relative to population size, because I did not have this data at hand.
- Size is using simple easing function. It seems to be a decent trade of between conveying scale and affected area. But a logarithmic scale may be better.
- I'm using dots to represent the affected areas. I would much rather highlight regions (not full countries). Unfortunately I could not find a region/province data set.
- Using a plane to show the map instead of a sphere means distortions are inevitable. However a different projection may better reflect the size of the affected area.
Final words
I've tried to make fair trade offs between showing virus spread while respectfully reflecting the underlying data. But I may have missed something, please let me know. Or better yet, fork or create a pull request for the Github project.